Hospital spending in the United States reached $1.6 trillion in 2024 (KFF), and much of that cost is driven by how efficiently patients move through care. Emergency departments alone saw 155.4 million visits in a year (CDC), while outpatient clinics, imaging centres and diagnostic units handle many more. When patient flow breaks down, the result is crowded waiting rooms, idle exam rooms in one area and overloaded ones in another, longer stays and frustrated patients and staff.
Patient flow describes the movement of patients through a healthcare facility, from arrival and registration through assessment, testing, treatment and discharge. Good flow means patients receive the right care at the right time with minimal waiting. Poor flow means queues, delays and wasted capacity. Because flow depends on the interaction of many variable steps, it is extremely difficult to analyze with averages alone. Simulation-based patient flow analysis captures that variability and shows how the whole system behaves.
Key Challenges in Patient Flow
Variability in arrivals and service times is the core difficulty. Even when average capacity seems sufficient, random fluctuations create queues that averages cannot predict.
Mismatched schedules are a frequent cause of delay. If patients are booked to arrive in large blocks while clinicians start consultations later, waiting rooms fill early and stay crowded for hours.
Another major concern is hidden bottlenecks. A single step, such as kit preparation, imaging or a shared exam table, can limit the throughput of the entire facility while other areas sit underused.
Uneven room and space utilization leads to congestion in some areas and idle space in others.
Shared resources across patient groups add complexity. Inpatients, outpatients and emergency cases often compete for the same scanners, labs and specialists.
Finally, lack of visibility makes improvement hard. Many facilities know their overall waiting time but not where in the journey the waiting actually occurs.
A patient flow simulation model represents every step of the patient journey, the resources at each step and the rules for moving between them. It produces detailed measures that are difficult to collect in real life, and it allows teams to test improvements before implementing them.
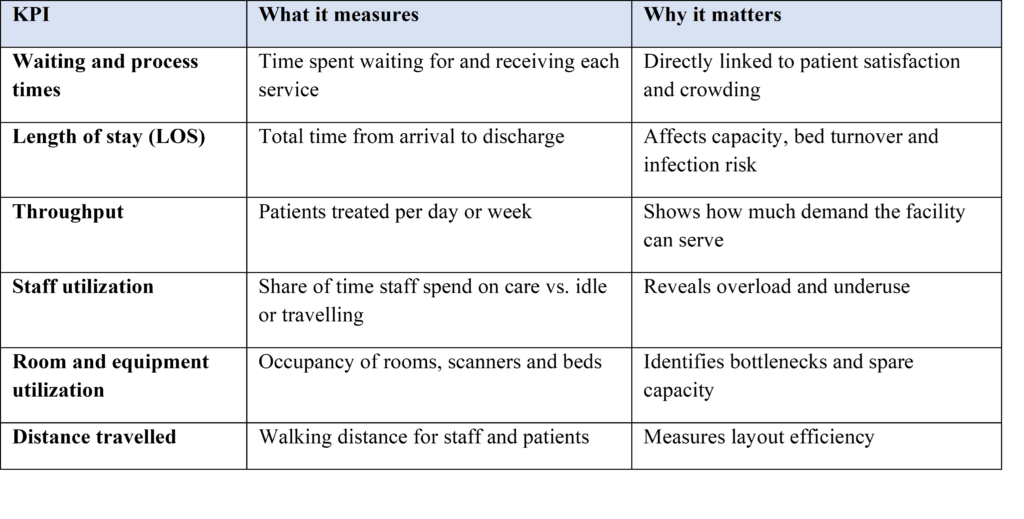
Patient flow studies typically track a consistent set of key performance indicators (KPIs):
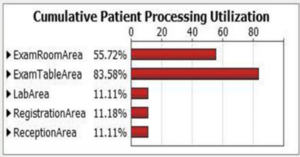
One of the most valuable applications is pinpointing where patients wait. At a large cancer institute outpatient department in India, a FlexSim model showed that patients spent an average of about 133 minutes in the clinic, with most of that time spent waiting for a room. Area utilization data showed the examination table area running at about 84% while registration, reception and lab areas sat near 11% — a clear signal of where capacity needed to be added (Singh et al., 2022).
Utilization of different clinic areas in a cancer outpatient department. Source: Singh et al., 2022.
Simulation also plays a critical role in aligning schedules with demand. In an obstetrics and gynaecology specialist clinic in Malaysia, a DES model tested earlier consultation start times and staggered patient arrivals in 30-minute slots. Combining both changes could reduce overall turnaround time by up to 40% for public patients and 21% for private patients, and cut the number of patients waiting in the clinic during peak hours by 10–21% (Fun et al., 2022).
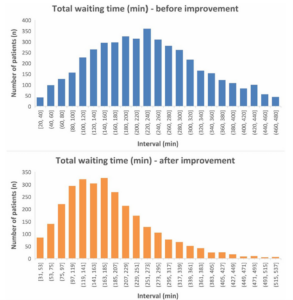
Another important capability is evaluating flow using real operational data. A general ophthalmology clinic in Germany used big-data simulations based on electronic health record timestamps to test capacity improvements, measuring total waiting time from registration to the ophthalmologist’s final record update. After the improvement, the distribution of waiting times shifted noticeably toward shorter waits (Kern et al., 2021).
Distribution of total waiting time before and after improvement in an ophthalmology clinic. Source: Kern et al., 2021.
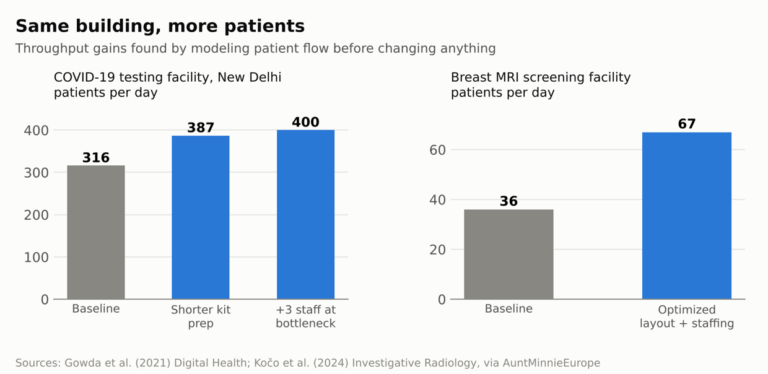
Simulation further supports finding and fixing bottlenecks to increase throughput. At a COVID-19 screening and testing facility in New Delhi, the FlexSim model showed that adding three staff at the kit preparation step would raise maximum throughput from 316 to 400 patients per day, an option that was then implemented (Gowda et al., 2021). In a breast MRI screening facility, restructuring workflow, layout and staffing raised projected throughput from about 36 to 67 patients per day, with three radiographers and four changing rooms identified as the most efficient setup (Kočo et al., 2024) (AuntMinnieEurope).
Throughput gains identified through patient flow simulation (chart prepared by Simulation Bureau from the cited studies).
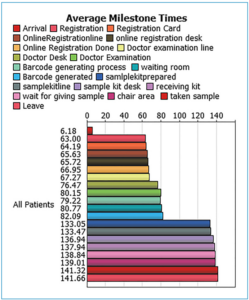
Modern patient flow models also help track every milestone of the patient journey. FlexSim dashboards can report average milestone times from arrival to registration, examination, sample collection and departure, showing exactly where minutes accumulate (Gowda et al., 2021). In a multi-department clinic, comparing current and proposed milestones showed median waits for providers falling from about 41 to under 9 minutes and waits for rooms dropping by about 55% (Zamani, 2023).
Average milestone times across the patient journey in a COVID-19 testing facility. Source: Gowda et al., 2021.
Simulation is also highly effective for managing shared resources. In MRI centres that serve both outpatients and inpatients, simulation combined with stochastic programming showed that many outpatients waited longer than the hospital’s target, with some waiting over two hours, and was used to design better scheduling rules (Sun et al., 2021). Similar models have been used to estimate resource utilization in dental clinics (Atalan & Keskin, 2023) and to redesign labor and delivery capacity (Nankali et al., 2025).
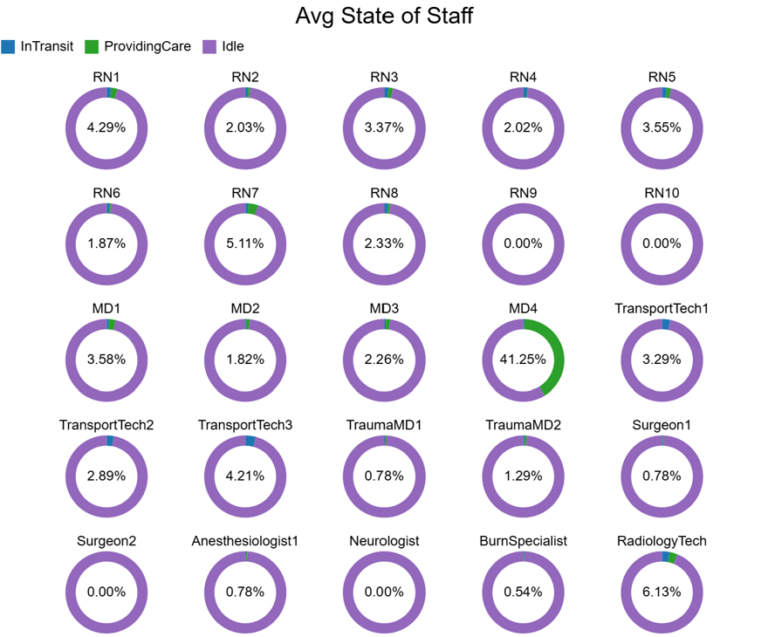
Patient flow dashboard (Average state of Staff)
Overall, simulation-based patient flow analysis gives healthcare organizations a clear, quantitative picture of how patients move through their facilities. It reveals where time is lost, tests improvements safely and helps deliver faster, smoother care without necessarily adding new buildings or staff.